Tuist, especially tuist generate, is run often. We need to ensure that the command is fast. On top of that, we should put checks in place, so the performance does not deteriorate again in the future.
About
- Champion: @marekfort
- Expected finish date: end of 2024
Why
Tuist relies on project generation to get rid of excessive merge conflicts by defining projects in Swift and builds on top of the project generation to provide extra functionality such as caching.
But to work with a Tuist project, developers need to generate Xcode projects often. On warm runs, this action can take up to 10 seconds in large projects – this performance is subpar, to say the least.
Goals
The goal is to cut the generation time by 50 - 80 %. Additionally, we should track the command run times in our public dashboard to ensure we don’t regress performance again the future. That data will only surface anonymous telemetry data from users signed up on the Tuist server as otherwise, we don’t have any tracking.
Initial measurements
The baseline measurements on my MacBook M3 Pro with 36 GB of RAM are the following.
Fixture
The first point of measurements is a fixture generated by the tuistfixturegenerator command. The tested project was generated with tuistfixturegenerate --projects 10 --targets 30 --sources 300.
Using the hyperfine command, we got the following results:
# Cold runs
Benchmark 1: tuist generate --no-open
  Time (mean ± σ):      3.630 s ±  0.162 s    [User: 23.107 s, System: 3.319 s]
  Range (min … max):    3.400 s …  3.812 s    10 runs

# Warm runs

Benchmark 1: tuist generate --no-open
  Time (mean ± σ):      3.268 s ±  0.281 s    [User: 24.825 s, System: 2.128 s]
  Range (min … max):    2.895 s …  3.574 s    10 runs
Real-world project
We have an access to a real-world project that we unfortunately can’t share. The initial measurements are the following:
# Cold runs
Benchmark 1: tuist generate --no-open
  Time (mean ± σ):     12.006 s ±  0.181 s    [User: 21.492 s, System: 4.961 s]
  Range (min … max):   11.849 s … 12.471 s    10 runs

# Warm runs
Benchmark 1: tuist generate --no-open
  Time (mean ± σ):      6.354 s ±  0.244 s    [User: 10.129 s, System: 2.629 s]
  Range (min … max):    6.096 s …  6.816 s    10 runs
Proposed solution
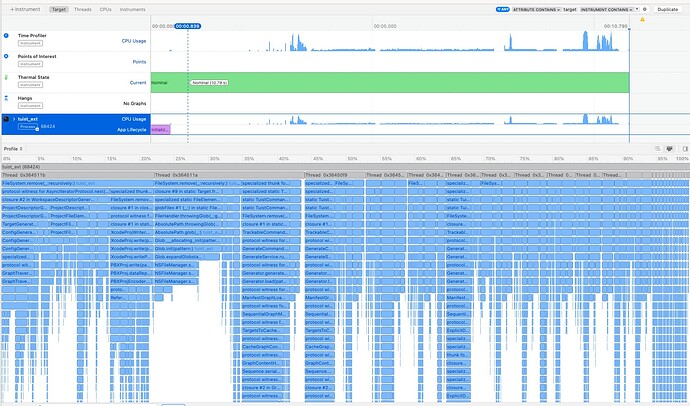
After initial investigation with Xcode Instruments, we found out we’re not leveraging the CPU efficiently. The CPU is unused for large stretches of time:
The current migration to FileSystem and Command utilities that are built with Swift concurrency will help us to parallelize – primarily globbing and hashing files are operations where we can benefit a lot from parallelization. As part of this initiative, we aim to finish the migration and ensure we parallelize where it makes sense.
We will also optimize some of the slowest methods. For example, ConfigGenerator.swiftMacrosDerivedSettings is a blocking operation that takes ~4.7 % of the time. Blocking operations like this have an outsized impact on the overall performance.
By the end of this project, the CPU usage should be highly more efficient – there should be no long stretches of time when the CPU is underutilized. We will use the performance dashboard to track our progress.
We will continue updating this initiative as we dig deeper.
